AI Venture Outlook | Q3 2025: Momentum Persists as Capital Bets on “Certainty”

In the 2025 landscape of AI financing, the once-twin terms “bubble” and “boom” are giving way to “structural reconfiguration” and “certainty-driven investing.” The era of placing a single, all-in bet on general-purpose models to “win every track” is receding. Capital is zeroing in on companies with clear technological moats and validated business models. From models to the underlying infrastructure and into deployments across countless industries, AI entrepreneurship is entering a new phase of rebuilding trust.
Grounded in multidimensional data and trend tracking from Silicon Valley Technology Review (SVTR)’s AI Venture Database, the AI Venture Outlook series systematically maps the latest financing structure of the global AI market—from capital allocation across the three-layer tech stack, to the generational and geographic profiles of startups, to shifts in VC strategies and the evolution of founder lineages. For founders and investors focused on medium-term opportunities in AI, this is not only a dynamic market guide but also a roadmap to understanding how future technologies will monetize.
I. Global AI Funding Overview
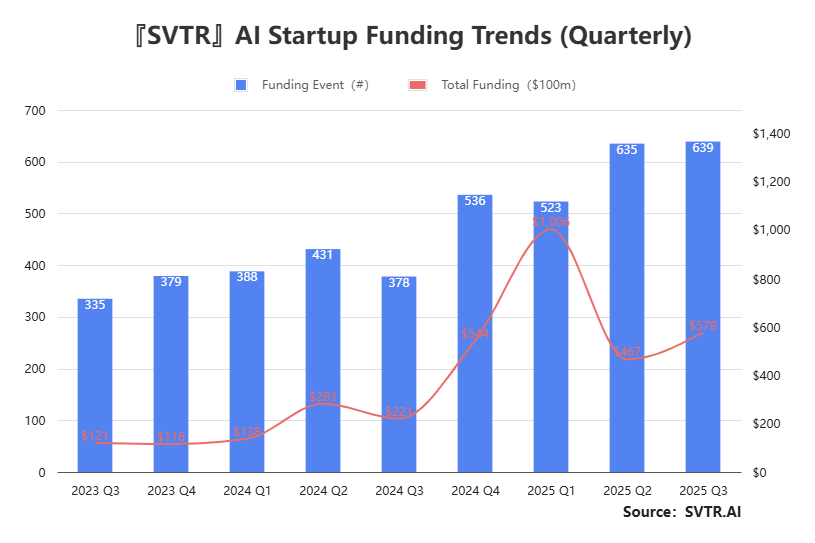
Heat persists while the structure diverges—incremental capital is returning to sectors and companies that both run viable businesses and build defensible moats.
Q1 2025 peaked at $107.8B, driven primarily by mega-rounds in the model layer; Q2 normalized and pulled back; Q3 saw volume up and pricing/valuations up, highlighting strong market resilience.
A sustained high deal count alongside a renewed rise in total dollars shows VCs haven’t left; capital is being allocated more rationally in the pursuit of “certainty.”
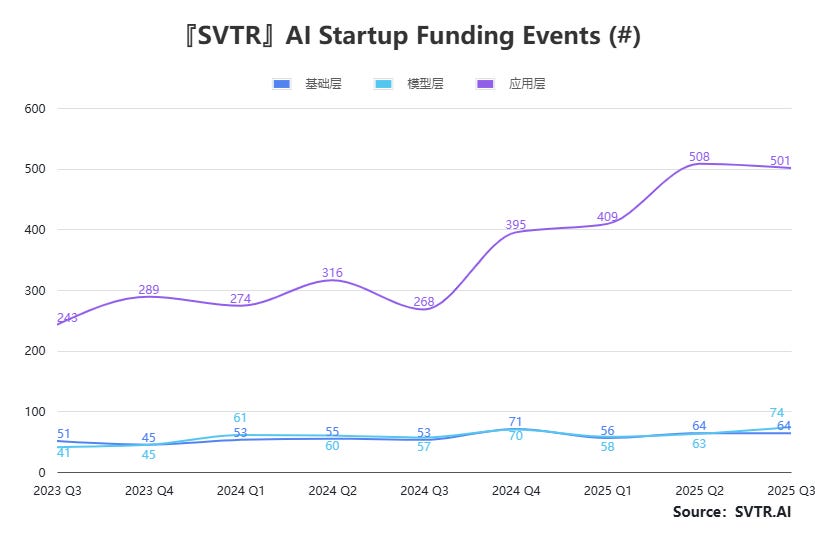
Volume in applications, dollars in models—the division of labor across the stack is increasingly clear.
The application layer consistently accounts for ~75%–80% of deal count, directly reflecting market heat and spillover demand.
Model and infrastructure layers show relatively steady deal counts, skewing toward “fewer but larger” rounds with a technology/capacity-build profile.
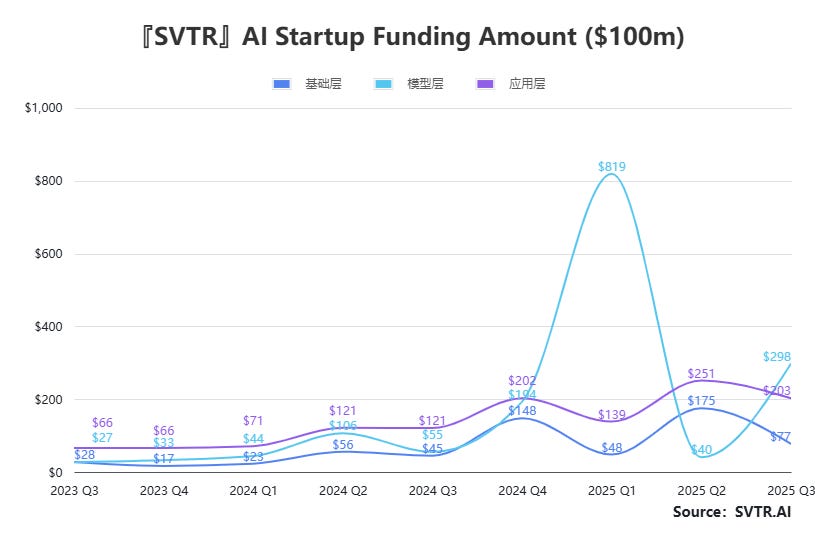
Peaks come from a few mega-rounds in the model layer, while steady, broad mid-sized rounds in applications drive the incremental growth. Structurally: “Dollars in models, increments in applications.” Capital keeps betting on foundational/model mega-projects, while go-to-market and commercialization sustain fundraising on the application side.
Q1 2025: the model layer hit a single-quarter high of $81.9B, then eased over the next two quarters, yet remained well above the infrastructure and application layers.
Applications: funding has trended up steadily since Q4 2024 and stayed elevated in Q3;
Infrastructure: continued a modest upward trajectory.
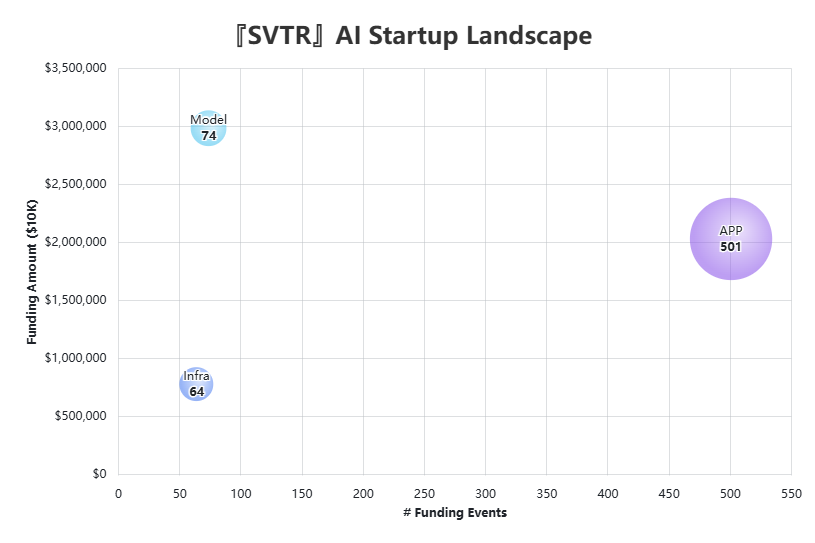
II. Funding Profile of AI Startups
Application layer: 501 deals — the broadest ecosystem, spanning the most sub-sectors.
Model layer: 74 deals / highest capital — a handful of mega-rounds drive total raise elasticity.
Infrastructure layer: 64 deals — funding fluctuates with compute/data cycles.
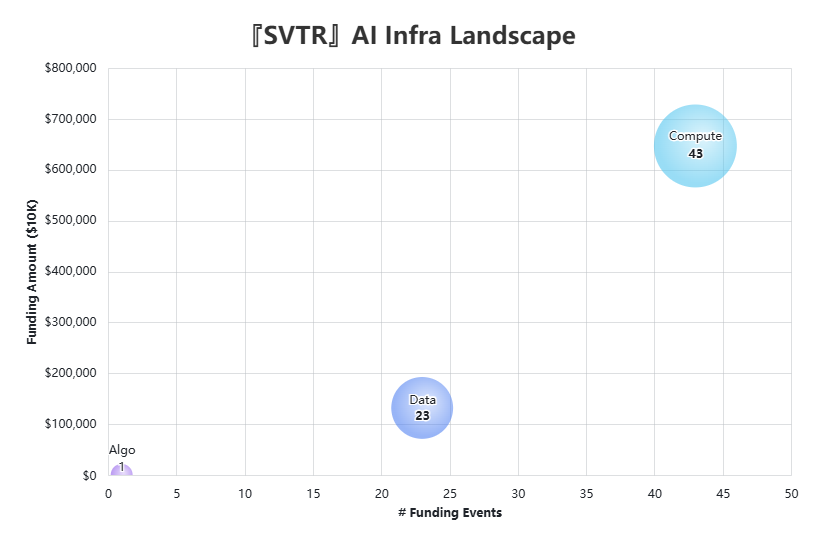
2.1 Infrastructure Layer: Capital still targets the supply-side bottlenecks—compute first, then data, lastly frontier algorithms
Compute is the absolute core (~43 deals; highest share of dollars), accounting for the bulk of infrastructure-layer funding.
Data comes next (~23 deals), focused on data generation, governance, and quality improvement.
Algorithms take a very small share, mostly frontier research and exploratory bets.
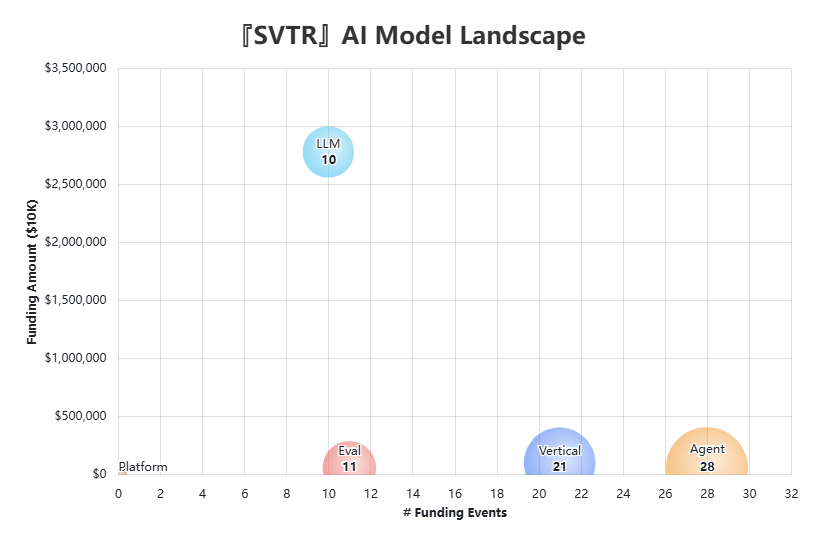
2.2 Model Layer: the base (foundation models) captures capital; the ecosystem (agents/verticals) drives deal count
Foundation models: few deals (~10) but dominant in total dollars, continuing to absorb the mega-rounds.
Agents (~28) and vertical models (~21): more active in deal count, with mid-sized tickets.
Optimization/Evaluation (~11): smaller in number but emerging as must-have infrastructure.
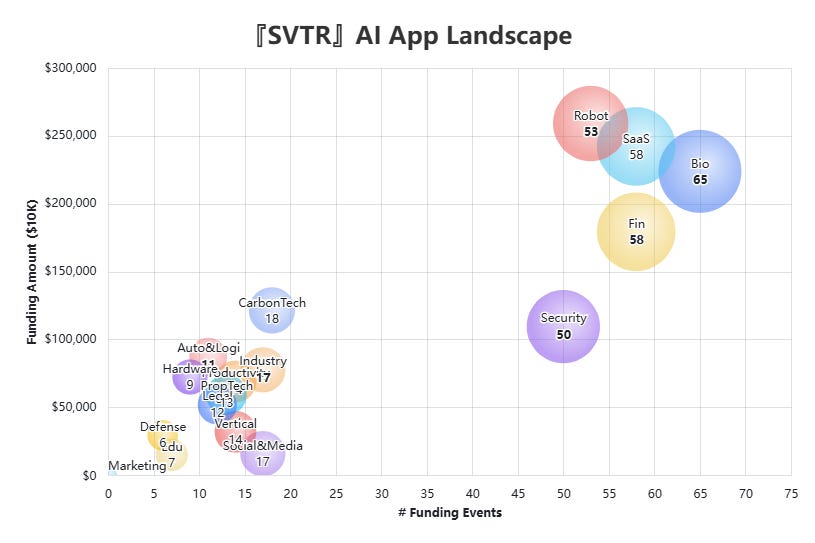
2.3 Application Layer: B2B strong scenarios (cost-out & productivity, risk/compliance, high ARPU) keep attracting capital; industrial and decarbonization enter a near-term window
Life sciences, enterprise services, robotics, financial services, and security/compliance sit in the upper-right quadrant (high deal volume and large round sizes).
“Dual-carbon”/decarbonization has fewer deals but larger tickets—high capital density.
EdTech, legal tech, and defense/public safety remain in an early scale-up phase.
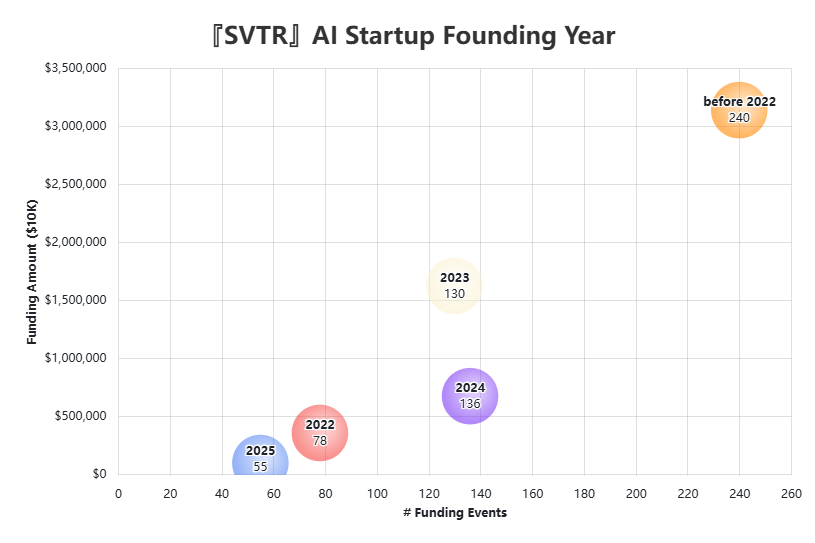
2.4 Founding Year: Capital tilts toward more mature, revenue-driving companies; newer cohorts are building momentum
≤ 2021 cohort: 240 deals, the largest contributor to total capital.
2023 cohort: 130 deals, notably active.
2024 cohort: 136 deals, high in count but with smaller ticket sizes.
2025 cohort: 55 deals, still in early validation.
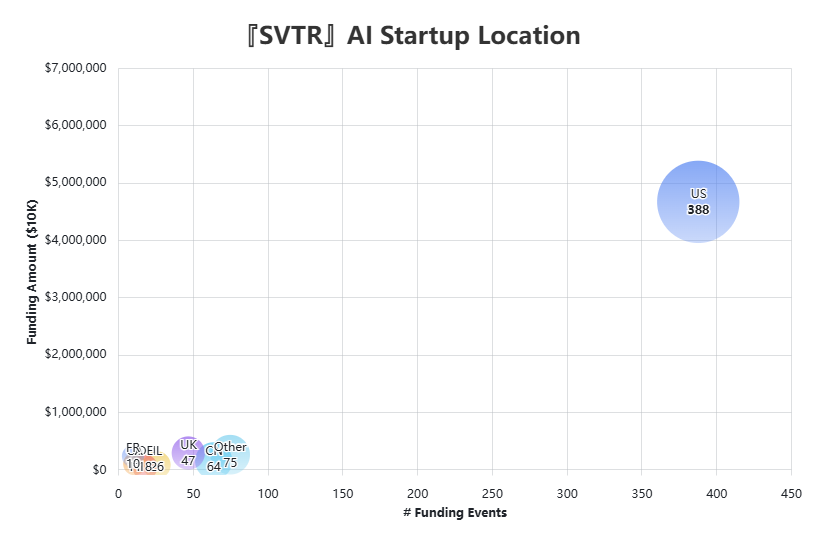
2.5 Geographic Distribution: a stable U.S. unipolar landscape, with others forming a long-tail
United States: 388 deals (~61%), commanding the clear high ground in both deal count and capital.
China: 64; United Kingdom: 47; Germany: 26; France: 10.
All others combined: 80 — a dispersed, long-tail pattern.
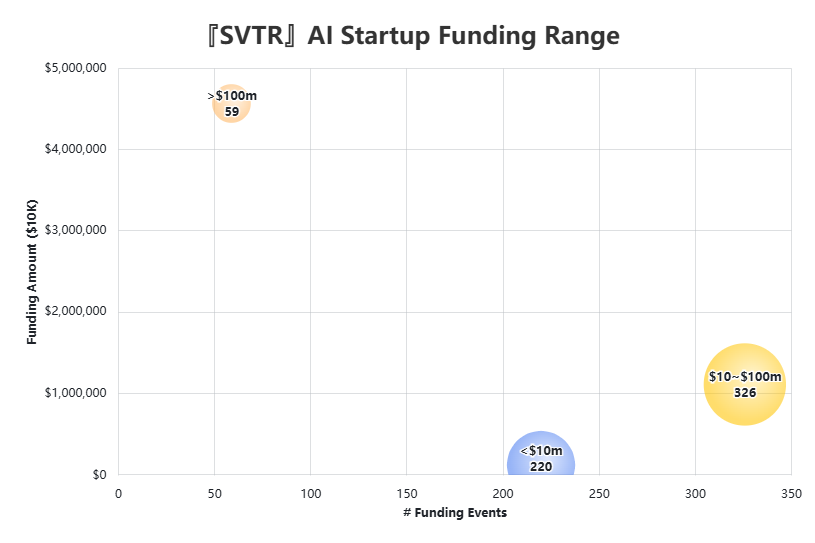
2.6 Round Size: A few mega-rounds + mid-sized core + small long tail
$10–$100M mid-sized rounds: 326 deals — the mainstream by count.
>$100M mega-rounds: 59 deals — contribute the vast majority of capital.
≤$10M early rounds: 220 deals — a stable long-tail supply.
III. AI Investors
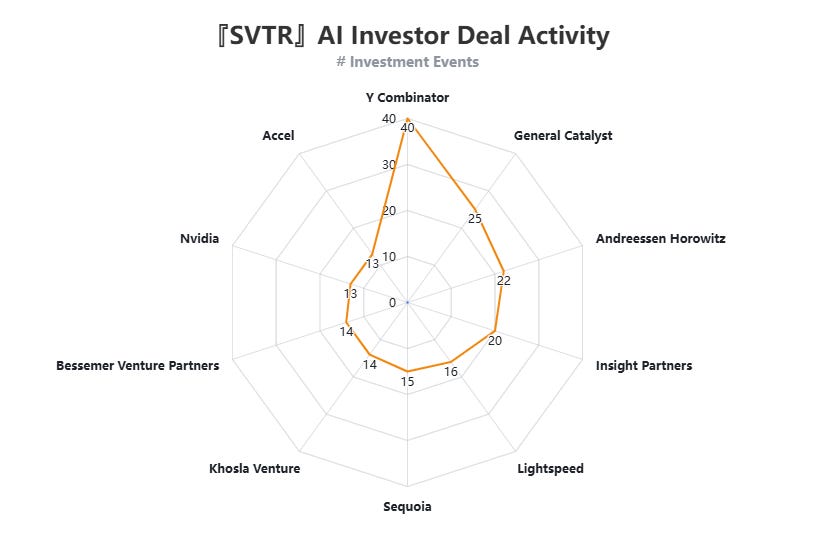
AI investing has entered a new normal where broad early-stage coverage and concentrated bets on leaders coexist. YC supplies massive early-stage deal flow, while top USD VCs and strategic corporates pick up momentum in mid-to-late stages. The top ten are mostly North American; corporate capital (e.g., NVIDIA) is active alongside accelerators/VCs.
Y Combinator (~40 deals) — far ahead, leading early-stage flow with many small checks.
Tier 2: General Catalyst (~25), Andreessen Horowitz (~22), Insight Partners (~20).
Tier 3: Lightspeed (~16), Sequoia (~15), Khosla Ventures (~15), NVIDIA (~13), Accel (~13), Bessemer Venture Partners (~14).
IV. AI Founders
The AI founder talent pipeline shows a Big Tech backbone with academia in parallel—a dual engine of engineering execution and frontier research.
Google leads by a wide margin (~38–40), followed by Meta (~25–30) and Microsoft (~24–26). Amazon and Intel (~16–20) trail closely, underscoring strong supply of platform-scale engineering experience.
MIT, Stanford, Cambridge, UC Berkeley, and other academic institutions contribute a meaningful share, signaling an active lab-to-startup path.
Consulting backgrounds (e.g., McKinsey) are a smaller slice, but add commercialization and go-to-market strength as a complementary capability.
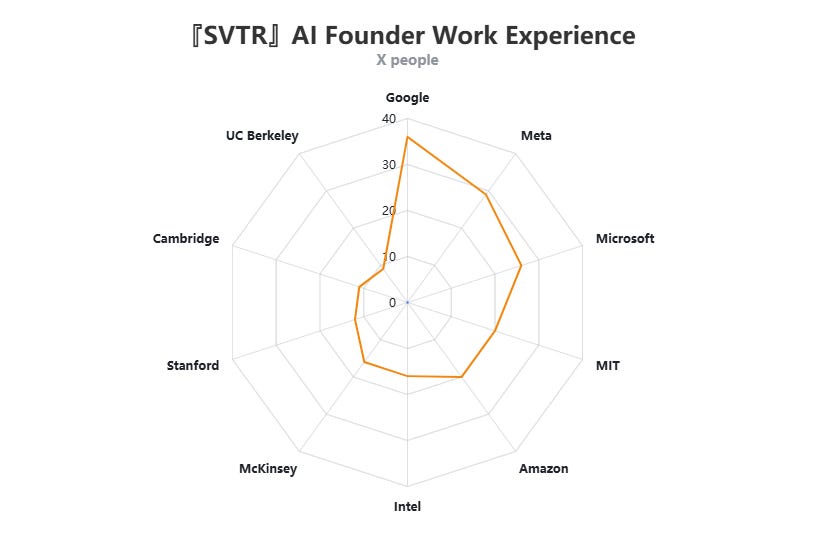
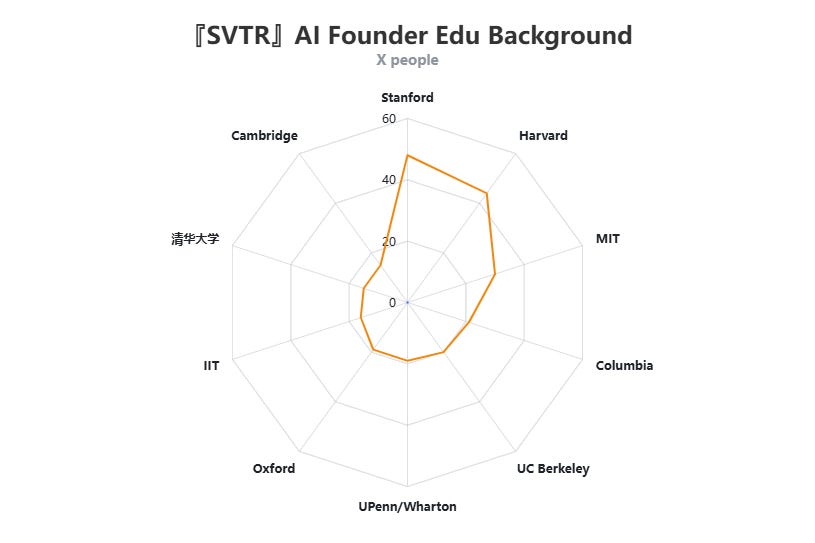
The Bay Area and the Boston corridor remain the primary “talent pools” for AI entrepreneurship, with elite alumni networks creating strong positive externalities for early team formation and fundraising. Overall, the talent mix is “U.S.-school led, complemented by top UK/China universities.”
Stanford ranks first (~55).
Harvard is second (40+).
MIT is third (~30).
Columbia, UC Berkeley, and UPenn/Wharton form the second tier (~14–22).
Oxford, Cambridge, IIT, and Tsinghua have a steady presence, though materially smaller than U.S. schools.
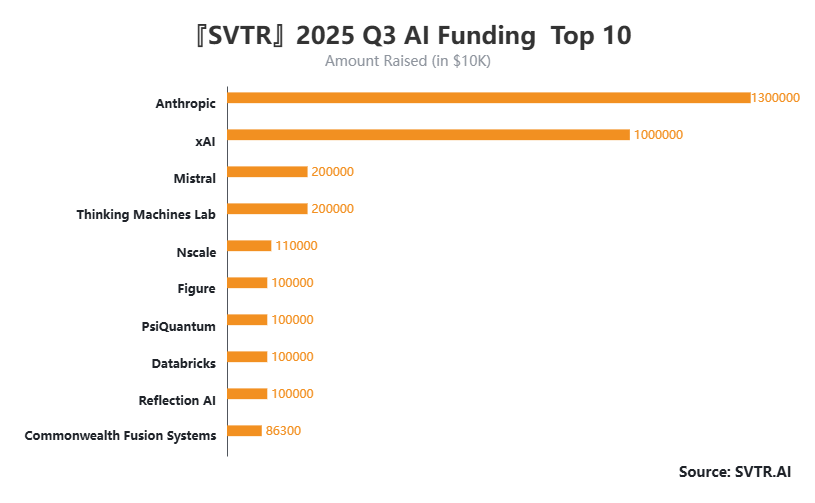
V. AI Quarterly Funding Top 10